


Population vs Prosperity: A Tale of Two Countries
Mapping Wealth: Population vs Prosperity for US and India

I currently work for a US-based MNC, and over the last two months, several members of the US leadership team have visited our Indian HQ. A common thread in their introductions has been their place of birth.
Now, my knowledge of US geography is very (very) limited. Apart from the obvious big cities, I only know about Seattle and Scranton, thanks to Frasier and The Office, respectively.
I got curious and started googling the most populous and prosperous US states. When I saw the top 4–5 states in both categories, something didn’t sit right with me intuitively. There were overlaps in the top 5—an observation I know isn’t true for India. So, I decided to gather some data, take a closer look, and, more importantly, ask questions.
Before we begin, The Data Signal is a free newsletter for Data Analytics enthusiasts. You can subscribe by clicking on this nifty button below
One thing I want to emphasize in this blog is asking more questions with data rather than jumping straight into building models or offering insights—that’s my day job anyway.
The Correlation
First, I calculated the correlation between population and prosperity (measured by nominal GDP per capita for the US and NSDP per capita for India). For India, the correlation was ~ -0.39. For the US, it was 0.30. But correlation alone doesn’t tell the full story.
So, here are the two plots:
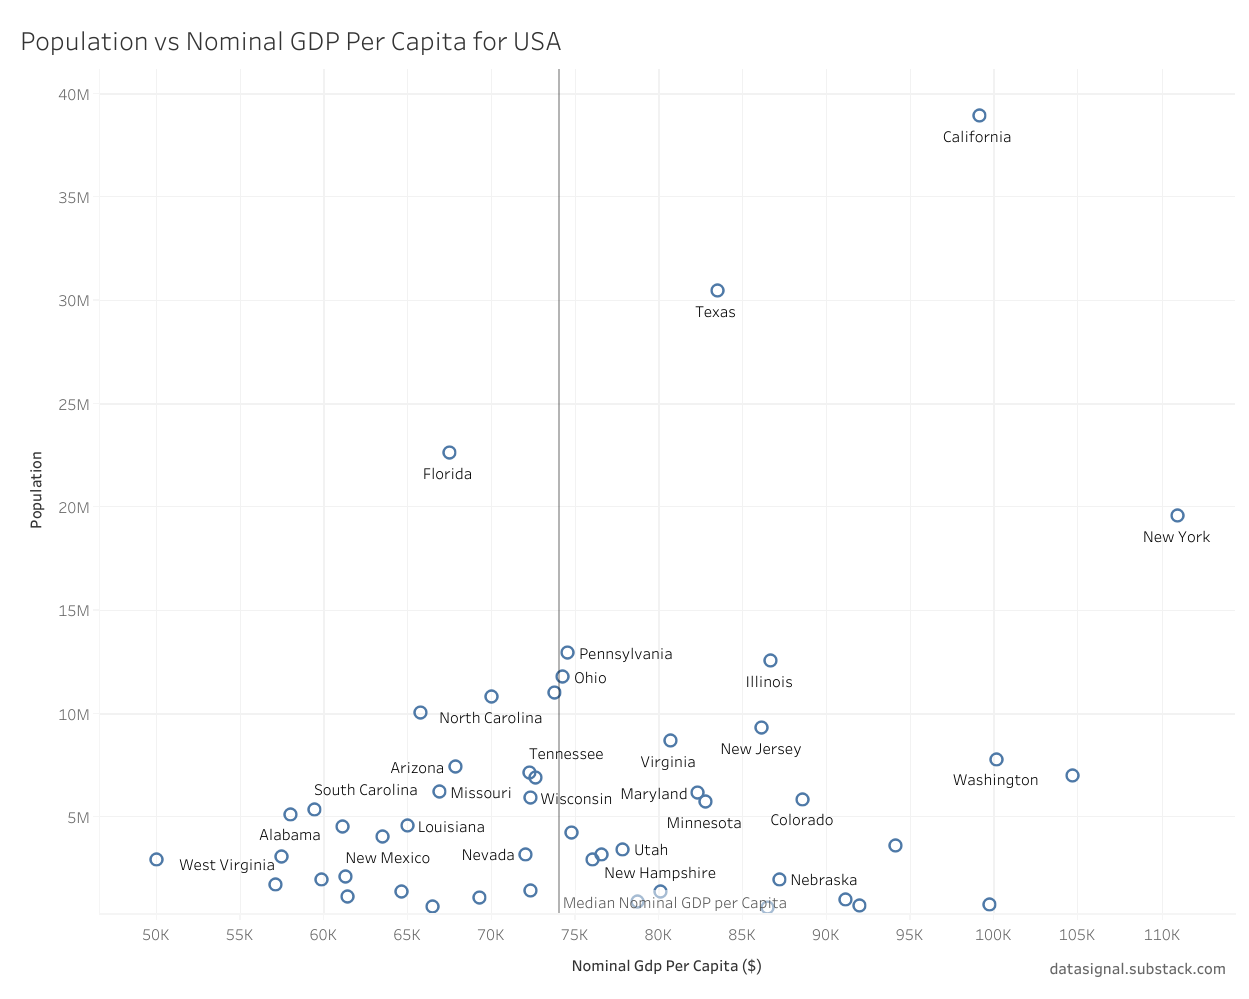
Plot 1: Population vs. Nominal GDP Per Capita for US States

Plot 2: Population vs. NSDP Per Capita for Indian States


Here are some data signals and questions based on these plots:
Signal 1: The Most Populous States
For the US, California, Texas, Florida, and New York are the most populous states. Among these, New York and California are also the two most prosperous states. Texas has a nominal GDP per capita higher than the state median, while Florida falls below it.
In India, the two most populous states—Uttar Pradesh (UP) and Bihar—are also the two least prosperous. The next most populous states—West Bengal, Rajasthan, Maharashtra, and Madhya Pradesh—paint a mixed picture, with only Maharashtra having an NSDP per capita higher than the median.
It starkly highlights the difference between the most populous states in India and the US. As more people move from rural to urban areas, you’d ideally want your most populous states to also be your most prosperous.
Signal 2: Horizontal Devolution and Urbanization
This brings us to one of the most debated topics in Indian politics: horizontal devolution, or the distribution of net tax proceeds among states. In India, a smaller proportion of the population pays taxes to support a much larger population.
The disparity in prosperity suggests that we haven’t been able to transition people from rural to urban settings as effectively as we’d like. This raises important questions:
Are our big cities—like Delhi-NCR, Mumbai, and Bangalore—“dense” enough?
If they were, shouldn’t more people have moved to these cities?
We often hear about the failing infrastructure of these cities, but if the disparity is this stark, it likely means the “metro dream” hasn’t come true for a majority of people.
Signal 3: Do We Have Enough Big Cities?
Now the “metro dream” doesn’t have to be fulfilled by these 3 big cities only.
So here is another big question: do we have enough “big metro cities” in India? Or do we need more?
Intuitively, in an ideal scenario, we’d want well-developed metro cities in all four regions. Something like:
West: Mumbai, Ahmedabad
East: Kolkata, Bhubaneswar, Jamshedpur
South: Bangalore, Hyderabad, Chennai, Amaravati
North & Central: Delhi-NCR, Indore
But we’re far from this reality.
Signal 4: Maharashtra’s Curious Case
Maharashtra surprised me (or maybe it didn’t). Even with Mumbai and Pune—two of the top eight metro cities—it’s only slightly ahead of the median NSDP per capita. This raises an interesting question:
How would states perform without their “star” cities?
This is an analysis I’d love to explore further. It might offer some data signals about which cities are truly lifting their state numbers and which states have developed robust rural infrastructure.
The Bigger Picture
So far, I’ve only compared India and the US. But what about other countries? How do China, Japan, or Canada compare?
Are they closer to India or the US in terms of population vs. prosperity dynamics? Is the distribution more even? And can we come up with a single metric to quantify these disparities?
Closing Thoughts
There’s no one-size-fits-all answer here, but this exploration opens up several avenues for further analysis. Whether it’s urbanization, horizontal devolution, or the role of metro cities, each of these factors plays a crucial role in shaping a country’s prosperity.
What are your thoughts on this? And what other questions can we ask with this data? And more importantly, to ask more questions, what data points I should be looking at? Please comment and let me know!
P.S.: I tried Tableau for the first time instead of R (ggplot2) for this blog. Does it look better than Seaborn or ggplot2?
Share it with someone who loves exploring stories hidden in data!