
The Curious Case of West Bengal's Disappearing Class 12 Students
One policy change, one shocking statistic, and many unanswered questions

Recently, I came across some surprising statistics. In West Bengal, for the final exam of Class 12, this year (2025) almost 3 lakhs fewer students appeared compared to previous years. The figure sounded mind-bogglingly shocking to me. The board secretary highlighted that this happened because they brought in a rule in 2017 - that mandated students need to be 10 years old in Class 5.
Still, the 3 lakh number is huge. Especially when we are far from hitting below the replacement level TFR. In any case, I got curious and wanted to explore what is happening with other states.
State Selection
Taking a look at 28 states would increase the noise more than the signal. And I don’t intend to publish a comprehensive comparative study of all the states. So, I cherry-picked a few, just to see how they’re doing:
Tamil Nadu: Often cited as a model state for educational outcomes. Good to have them as a benchmark.
Bihar: Eastern Indian state, West Bengal’s neighbor. Most populous state in the east. Lowest per capita income in the country.
Maharashtra: Western Indian state. Highest state GDP. Mix of urban and rural demographics.
Haryana: Northern Indian state. 7th richest in terms of per capita income.
Uttar Pradesh: Bihar’s neighbor. 2nd most populous state overall. Similar socio-economic profile to Bihar in many ways.
This selection gives us a mix of geographical regions, economic profiles, and educational performance levels - enough to see if West Bengal’s trend is an outlier or part of a broader pattern.
Let’s have a look at the absolute numbers - and their trends.
(Note: the numbers are quite decentralized. So I had to collate them from several sources. Directionally, this should be quite accurate.)
Absolute Numbers: Trends from 2021-2025
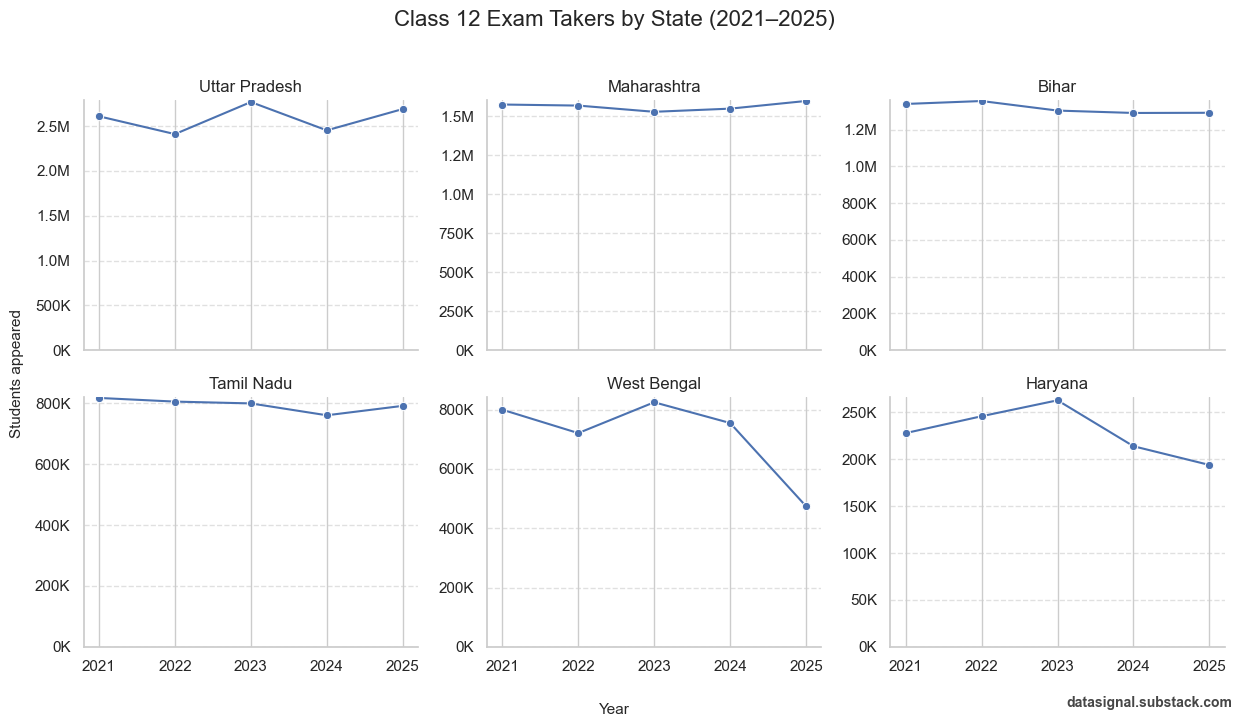
What stands out:
For Haryana and West Bengal, there has been a decline for 2 consecutive years. But others have shown a consistent pattern overall. For UP, the pattern is interesting - there’s some volatility, but it is still stable. No sharp decline like West Bengal.
The West Bengal drop is particularly dramatic: from approximately 800K students in 2021 to around 470K in 2025. That’s a 41% decline. Haryana shows a similar downward trend, though less severe - from about 230K to 195K (a 15% drop).
Maharashtra, Tamil Nadu, Bihar, and Uttar Pradesh remain relatively stable, with only minor fluctuations around their baseline numbers.
Summary: Year-on-Year Changes
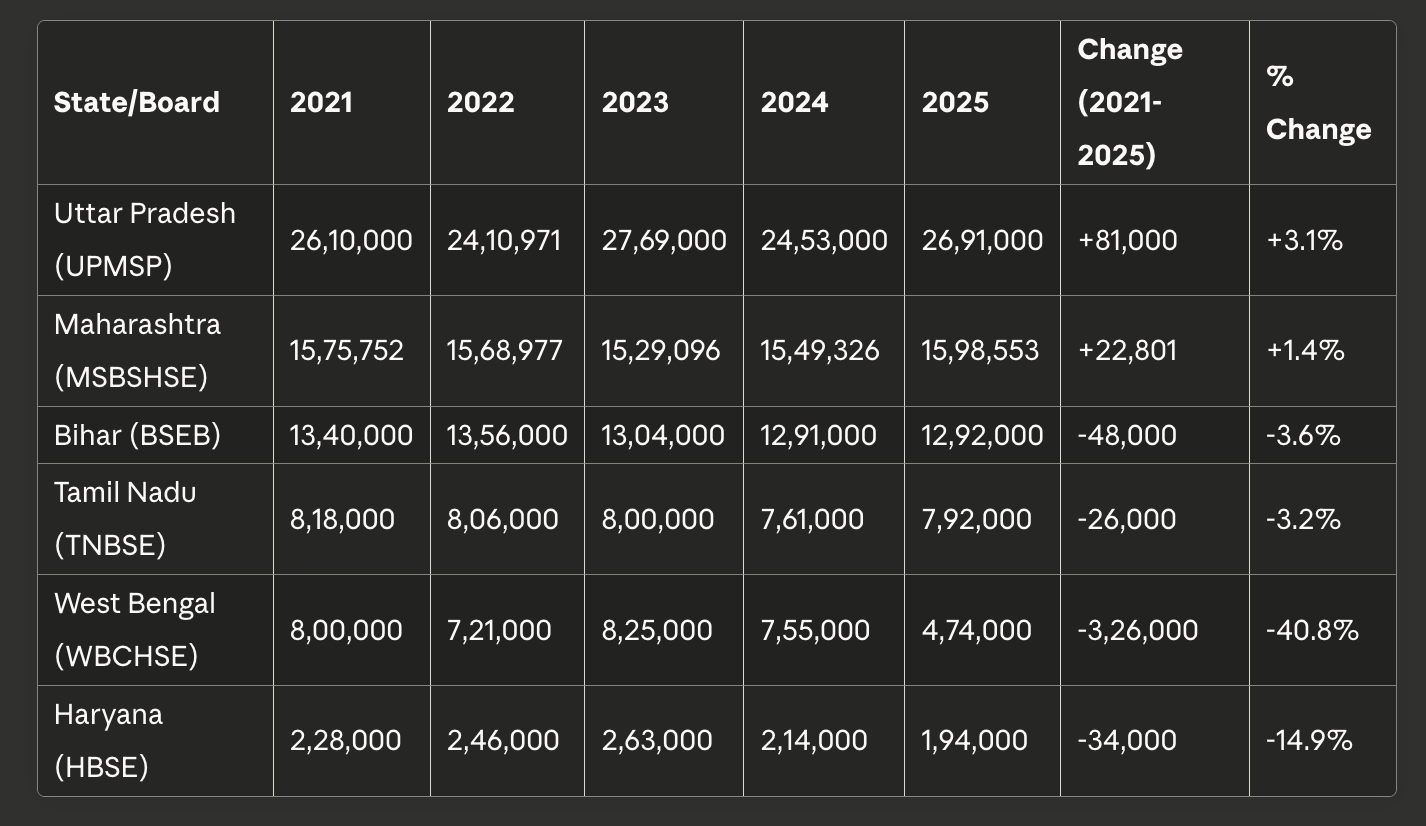
The table makes it clear: West Bengal’s decline is not just steep, it’s an outlier. No other state comes close to this magnitude of drop.
Normalizing by Population
Let’s take a look at the number of exam takers per 1000 population:
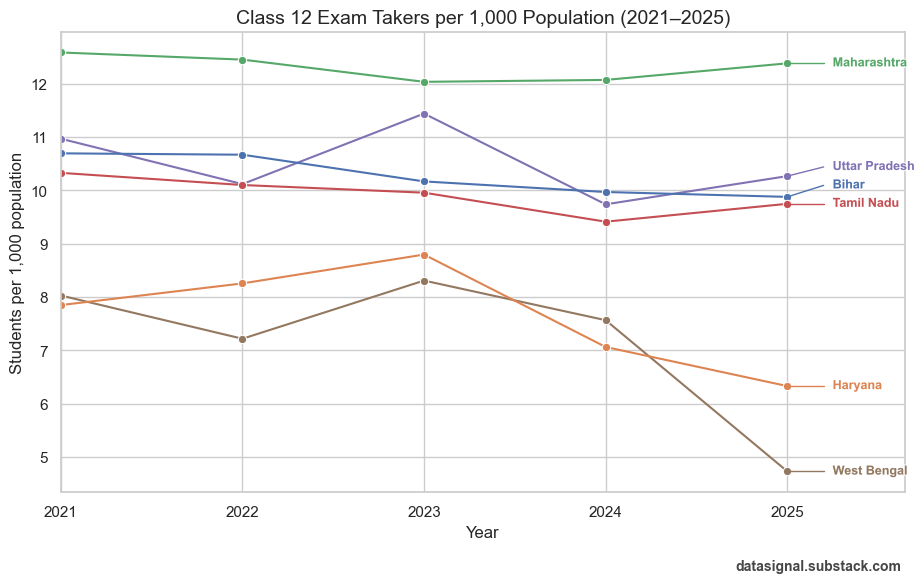
Data Signals:
Maharashtra maintains the highest rate throughout (around 12-13 students per 1,000 population), suggesting either better retention rates or favorable demographics. West Bengal’s rate drops dramatically from about 8 to under 5 per 1,000 population - confirming that this isn’t just a population effect, but a real decline in participation rates.
This chart reveals interesting patterns, but comes with a caveat. This has an implicit assumption: the proportion of the eligible age group (16-18 year-olds) within the total population is uniform across states. Which, obviously, is not true. States with younger populations will have proportionally more children under 10 and fewer teenagers, while states further along in demographic transition will have a higher share of the 16-18 cohort. But we don’t have more granular data readily available. At least, I couldn’t find one. Ideally, we should be looking at the base of 16-20 or 15-19 age cohorts. That would give us a better idea about the “eligible” group.
Another Proxy: Youth Population Base
The closest we can get to the ideal metric is the population of the 0-14 age group in 2021, which was published by Data for India. This can serve as a reasonable proxy for the eligible age group in 2025. What if we try to see the number of students appearing per 1,000 youth?
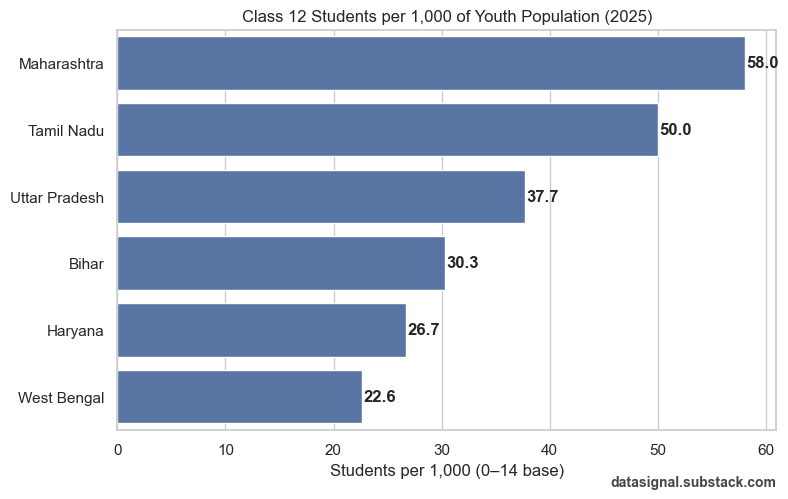
What this reveals:
It looks far worse for West Bengal. But this is a total guesstimation - at best. Here, ‘Youth’ is proxied by the 0–14 population share in 2021. By 2025, this group spans roughly ages 4–18. It’s not a perfect match to the Class 12 eligible cohort (≈17–18 years), but directionally, it reflects the size of the feeder base.
Maharashtra leads with 58.0 students per 1,000 youth, followed by Tamil Nadu (50.0) and Uttar Pradesh (37.7). West Bengal sits at just 22.6 - trailing behind Haryana (26.7).
This stark difference (58.0 for Maharashtra vs 22.6 for West Bengal) suggests one of two things:
Massive dropout rates between lower and upper secondary levels in West Bengal
Demographic differences - West Bengal might have a younger age structure with proportionally more children in the 0-10 range than the 10-14 range
Most likely, it’s a combination of both.
What Could Be Happening?
The 2017 Policy and the Overage Bulge
If the age mandate was introduced in 2017, requiring students to be 10 years old in Class 5, those students would hit Class 12 around 2024-2025. The timing checks out perfectly.
But here’s a critical question: Was there a bulge of overage students in earlier years that’s now correcting?
In many Indian states, particularly in rural areas, it’s not uncommon for children to start school late or repeat grades. If West Bengal had a significant population of unqualified students in the system pre-2017, the 2021-2023 cohorts might have represented this bulge working its way through. The 2024-2025 drop could then be the system “normalizing” to age-appropriate enrollments.
This would explain why the drop is so dramatic - it’s not just one year’s worth of students, but potentially 2-3 years’ worth of overage students who would have been in the system under the old regime.
Why Haryana?
Haryana’s decline is notable but less discussed. I haven’t found evidence of a similar age-mandate policy there. This warrants investigation. Possible factors could include:
Migration patterns (families moving for work)
Shift to private schooling or alternative examination boards (CBSE, ICSE)
Economic factors affecting school retention
Future Work
This exploratory analysis raises more questions than it answers (which has been my goal anyways for this newsletter):
Granular age-cohort data: Getting actual 15-19 or 16-20 population data by state would dramatically improve the accuracy of per-capita calculations.
Covid’s shadow: Does the pandemic have something to do with this? The 2024-2025 cohort would have been in Classes 9-10 during 2020-2021 (peak Covid years). If the pandemic disproportionately affected rural schooling (due to a lack of digital infrastructure), we might see this reflected in the numbers. Breaking down the data by urban-rural divide would help determine if Covid-induced dropouts are part of the story.
Pre-2017 enrollment patterns: Analyzing the age distribution of students in West Bengal’s secondary schools from 2015-2020 would reveal if there was indeed an overage bulge.
Dropout analysis: Where exactly are students dropping out? Between Class 8-10? Or 10-12? State-level progression ratios would be illuminating.
Cross-board comparison: Many students in urban areas take CBSE/ICSE boards instead of state boards. Are West Bengal’s numbers declining while CBSE enrollment is rising?
Haryana deep-dive: Understanding what’s driving Haryana’s decline could reveal factors beyond policy changes - economic trends, migration patterns, or shifts in educational preferences.
Long-term tracking: Will West Bengal’s numbers stabilize at this new lower level, or continue to decline? Data from 2026-2027 will be crucial.
Conclusion
West Bengal’s ~37% decline in Class 12 exam takers from 2024 to 2025 is unprecedented among major Indian states. While the 2017 age-mandate policy provides a plausible explanation - a correction after years of unqualified students in the system - the sheer magnitude demands deeper investigation.
As someone from West Bengal, these numbers are both surprising and worrying. They point to deeper structural issues in educational access, retention, or migration that go beyond a single policy change. Whether this is a one-time correction or the beginning of a longer-term trend will become clearer in the years ahead.
If you found this worth your time, please subscribe to The Data Signal - it’s free. I explore data, AI, analytics, and strategy, tackling interesting questions that don’t have obvious answers. It would mean the world to me, knowing that someone is finding value in my work.
Think someone else would find this interesting? Please share.